 United Kingdom
 Germany
 Denmark
 Sweden
 Italy
Italy Netherlands
 Norway
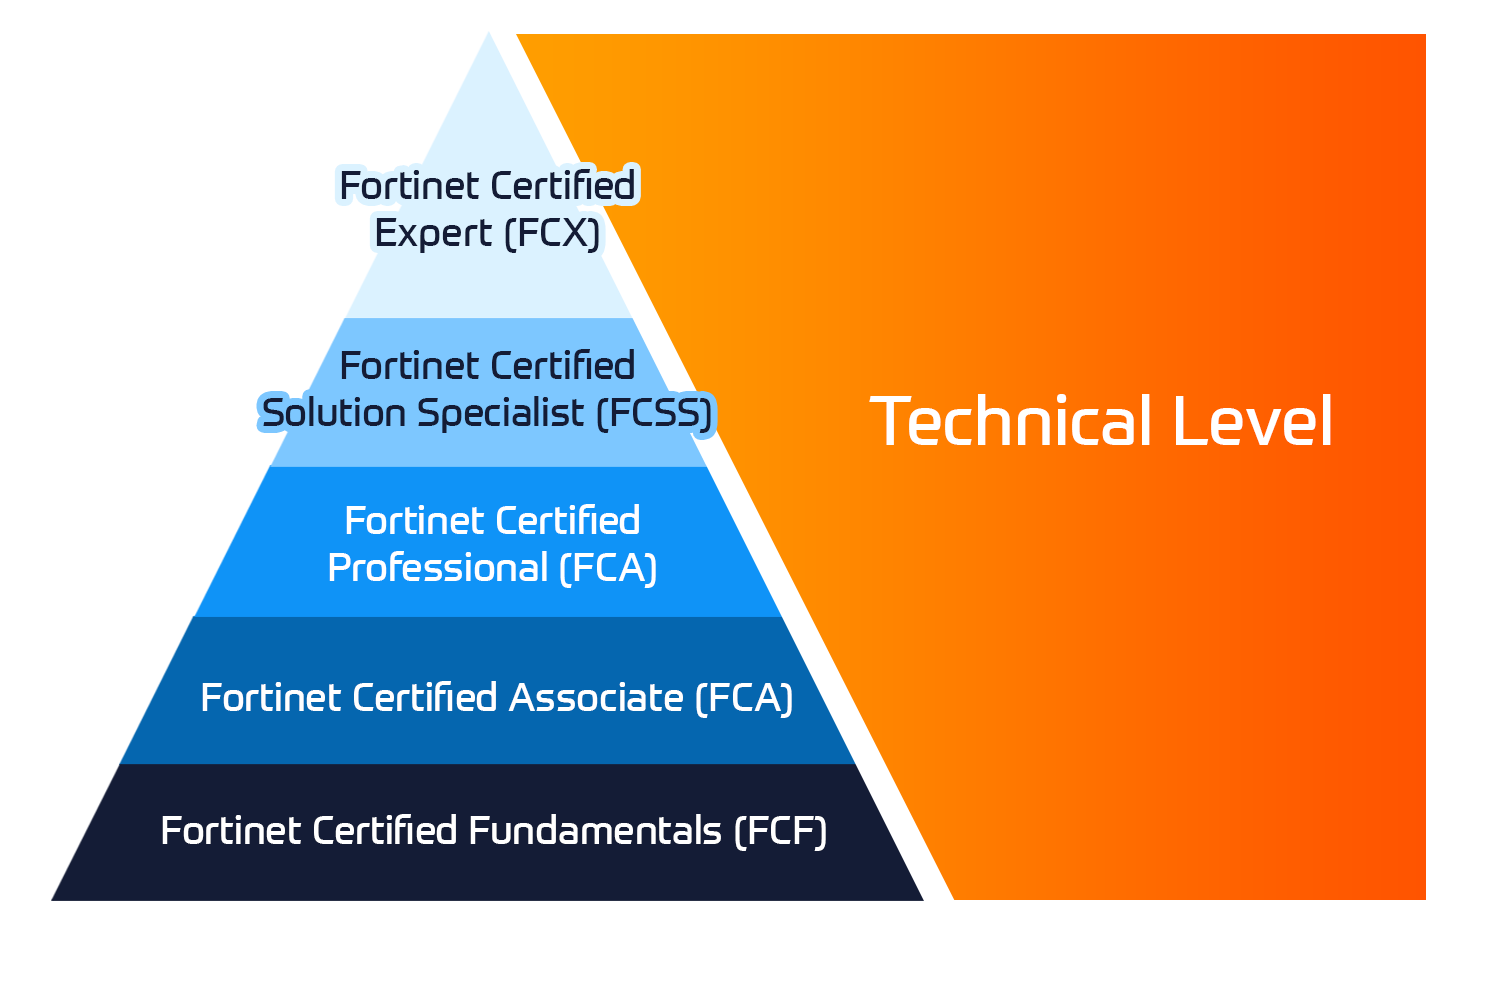

IT-toimittajien koulutusportfolio
Cisco

Fortinet

Extreme Networks

Microsoft
![IAPP [GDPR] Training](https://www.insoftservices.fi/wp-content/themes/lms/images/insoft-iapp-official-training-partner.png "IAPP [GDPR] Training")
IAPP (GDPR)
CertNexus
ForcePoint Training

Trellix

AWS

ITIL

CompTIA

PRINCE2

Palo Alto

CWNP


Insoft on palvellut IT-yhteisöä Ciscon virallisella koulutustarjonnalla vuodesta 2010. Tältä sivulta löydät kaikki olennaiset tiedot Ciscon koulutuksesta.
Katso lisää

Cisco opintopisteet (CLC) ovat suoraan Ciscon kanssa lunastettuja prepaid-koulutusseteleitä, jotka helpottavat menestyksen suunnittelua ostaessasi Ciscon tuotteita ja palveluita.
Katso lisää

Cisco täydennyskoulutusohjelma tarjoaa kaikille aktiivisille sertifioinnin haltijoille joustavia vaihtoehtoja uudelleensertifiointiin suorittamalla erilaisia kelvollisia koulutuskohteita.
Katso lisää

Sertifioidut työntekijät ovat ARVOSTETTUJA omaisuuseriä. Tutustu Ciscon valtuutettuun digitaaliseen oppimiskirjastoon ja kouluta itseäsi tallennettujen istuntojen avulla.
Katso lisää

Cisco Business Enablement Partner Program keskittyy Cisco Channel Partnersin ja asiakkaiden liiketoimintataitojen terävöittämiseen.
Katso lisää

Koulutus sisältää omatoimisia laboratorioita käytännön AWS-harjoitteluun tosielämän skenaarioissa, jolloin voit oppia omaan tahtiisi, luokassa, töissä tai verkossa.
Katso lisää

Extreme Networks Technical Trainingin kehitys tarjoaa kattavan progressiivisen polun associate-akkreditoinnista ammatilliseen akkreditointiin.
Katso lisää
Valtuutettuna koulutuskumppanina (ATP) Insoft Services varmistaa, että saat korkeimman saatavilla olevan koulutuksen.
Katso lisää

Maailmassa, jossa teknologiat kehittyvät nopeasti, jokainen yritys - yritys - tarvitsee kumppanin, johon luottaa ja luottaa verkkoinfrastruktuurinsa sujuvaan ja turvalliseen toimintaan.
Katso lisää
Missiomme: Tarjota asiantunteva joukko moderneja ja huippuluokan verkkoautomaatiotaitoja markkinoille asiantuntijapalvelujen avulla.
Katso lisää
Maailmassa, jossa teknologiat kehittyvät nopeasti, jokainen yritys - yritys - tarvitsee kumppanin, johon luottaa ja luottaa verkkoinfrastruktuurinsa sujuvaan ja turvalliseen toimintaan.
Katso lisää
Maailmassa, jossa teknologiat kehittyvät nopeasti, jokainen yritys - yritys - tarvitsee kumppanin, johon luottaa ja luottaa verkkoinfrastruktuurinsa sujuvaan ja turvalliseen toimintaan.
Maailmassa, jossa teknologiat kehittyvät nopeasti, jokainen yritys - yritys - tarvitsee kumppanin, johon luottaa ja luottaa verkkoinfrastruktuurinsa sujuvaan ja turvalliseen toimintaan.
Katso lisää
Maailmassa, jossa teknologiat kehittyvät nopeasti, jokainen yritys - yritys - tarvitsee kumppanin, johon luottaa ja luottaa verkkoinfrastruktuurinsa sujuvaan ja turvalliseen toimintaan.
Katso lisää
Autamme organisaatioita ottamaan käyttöön Software-Defined Networking (SDN) -ratkaisuja, kuten Cisco DNA:ta.Lisäksi tiimillämme on laaja kokemus Cisco DNA Centerin integroinnista kolmannen osapuolen järjestelmiin.
Maailmassa, jossa teknologiat kehittyvät nopeasti, jokainen yritys - yritys - tarvitsee kumppanin, johon luottaa ja luottaa verkkoinfrastruktuurinsa sujuvaan ja turvalliseen toimintaan.
Katso lisää
Koulutusvalikoimaamme kuuluu laaja valikoima IT-koulutusta IP-palveluntarjoajilta, mukaan lukien Cisco, Extreme Networks, Fortinet, Microsoft, muutamia mainitakseni, EMEA-alueella.
Katso lisää